t_results <- t.test(extra ~ group,
data=sleep, paired=TRUE)PER-QT Example:
A proof of concept in the style of the PERC Proceedings
This mini-paper is a proof of concept constructed in the style of the PERC Proceedings to illustrate our progress help us identify the major technical hurdles that remain. This shows that most of the major features needed to write an academic paper can be implemented, but there are specific issues around tables. If successful, this project could help PER researchers produce research faster, with better reproducibility, and disseminate it in a wider range of accessible formats.
Introduction
Scientific writing is almost impossible without the ability to reference sources (Knauff and Nejasmic 2014); and ideally, we want to be able to reference any source, Knauff and Nejasmic (2014), in multiple, flexible ways.
As important as it is to reference others, we also need to be able to reference other parts of our own work to signpost if we are going to:
Methods
Statistical methods would be hard to write if you could not show the exact formula used, such as Equation 1, which shows Cohen’s \(d\). A unique benefit of this format though, is that one can embed the exact code used in analysis, as in the R code below, or just transparently publish your entire source code.
\[ d = \frac{\bar{x}_1-\bar{x}_2}{s} \tag{1}\]
Results
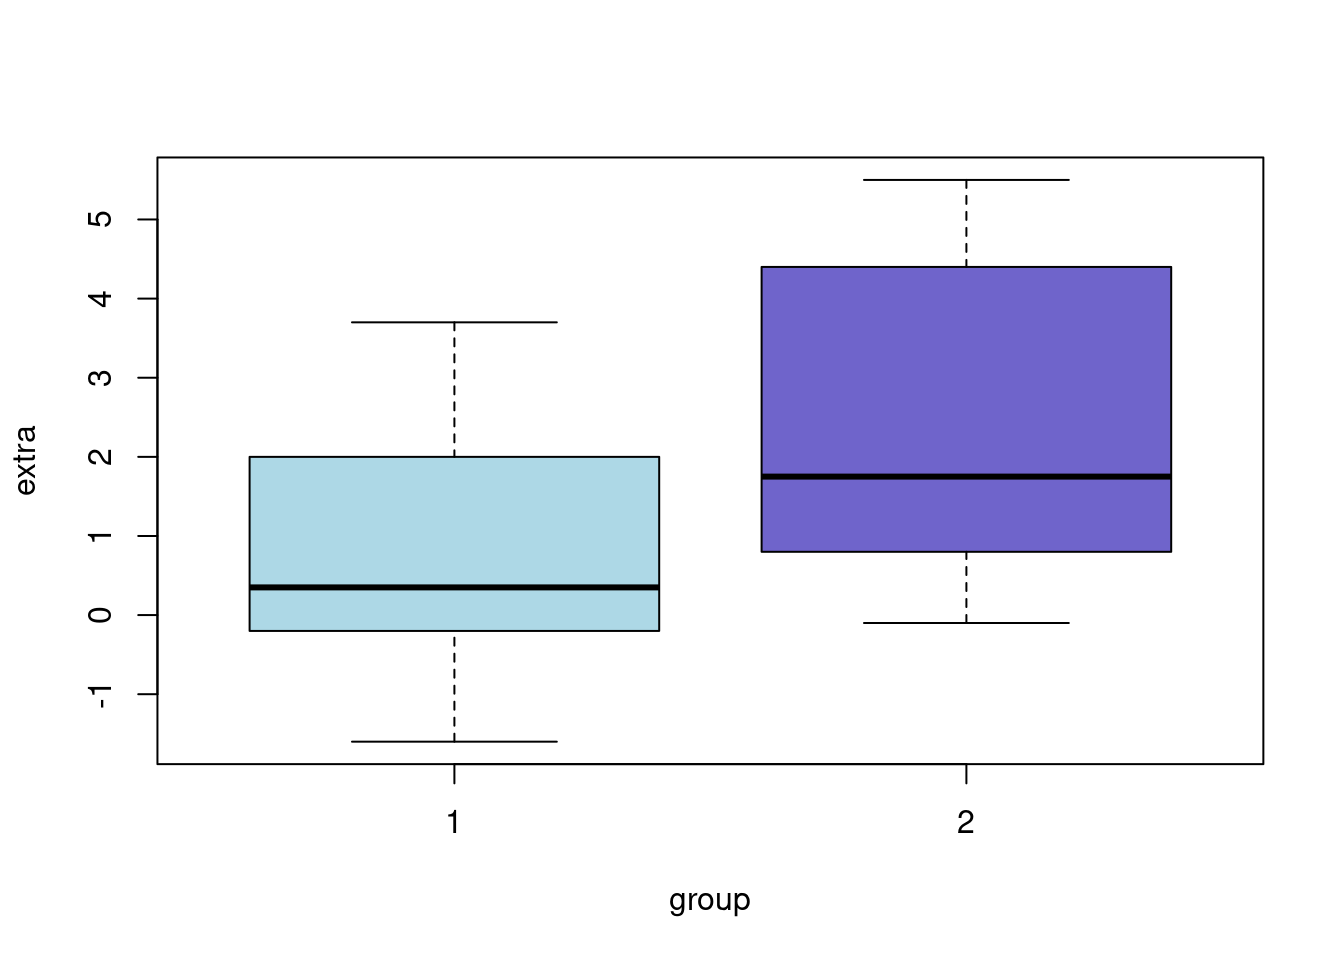
boxplot(extra ~ group, data=sleep, col=c("#add8e6", "#6f64cb"))
Results can be plotted directly from code, just look at Figure 1! You can even embed the results of significance tests inline, quoting that with a paired t-test, Treatment 2 appears better than Treatment 1 with p = 0.0028329.
Unfortunately, the compatibility issues around REVTEX tables have proven particularly difficult to resolve. The best solution we have at the moment is writing out tables like Table 1 out manually specifically for REVTEX PDFs.
tibble::as_tibble(sleep) |>
  dplyr::group_by(group) |>
  dplyr::summarise(mean(extra)) |>
knitr::kable()| group | mean(extra) |
|---|---|
| 1 | 0.75 |
| 2 | 2.33 |
Discussion
Overall, this proof of concept appears to work well so far, but further development and “real world” testing is needed.